LOG DATA ANALYSIS
Anomalies in Logs
To demonstrate usability of the Qubinets platform, we selected very frequent use case of log processing. How to find an optimal solution for my log anomaly detection? Which database tools to store logs, which ML/DL models to process streams of logs?
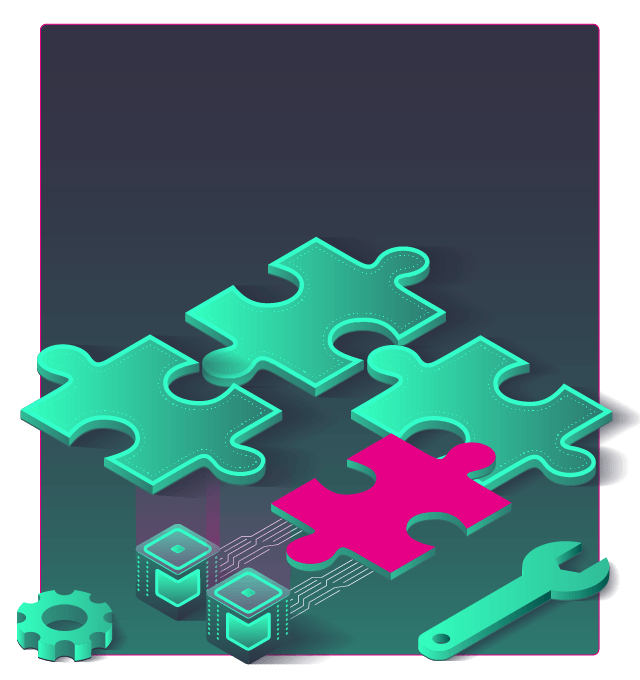
SELECTED QUBES
Building blocks for complete log anomaly detection solution
This is pure Kappa architecture; data in motion – sources of logs push them to message bus, which makes data available both for database engines and realtime distributed processing mechanisms.


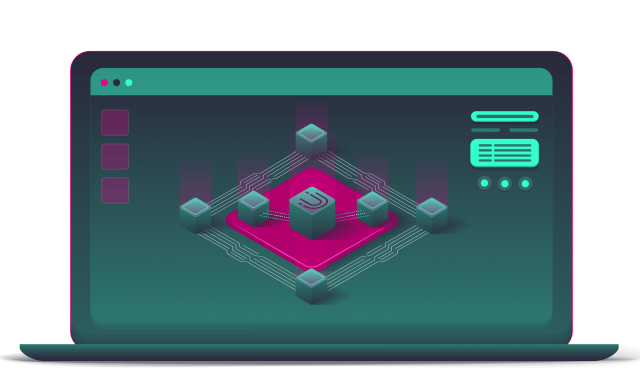

QUBINETS PLATFORM USABILITY
Focus on problem and not on data infrastructure
Setup the infrastructure by dragging Qubs of your choice. Connect them using data integration Qubs of your choice. Deploy, run and check performance. Decide.
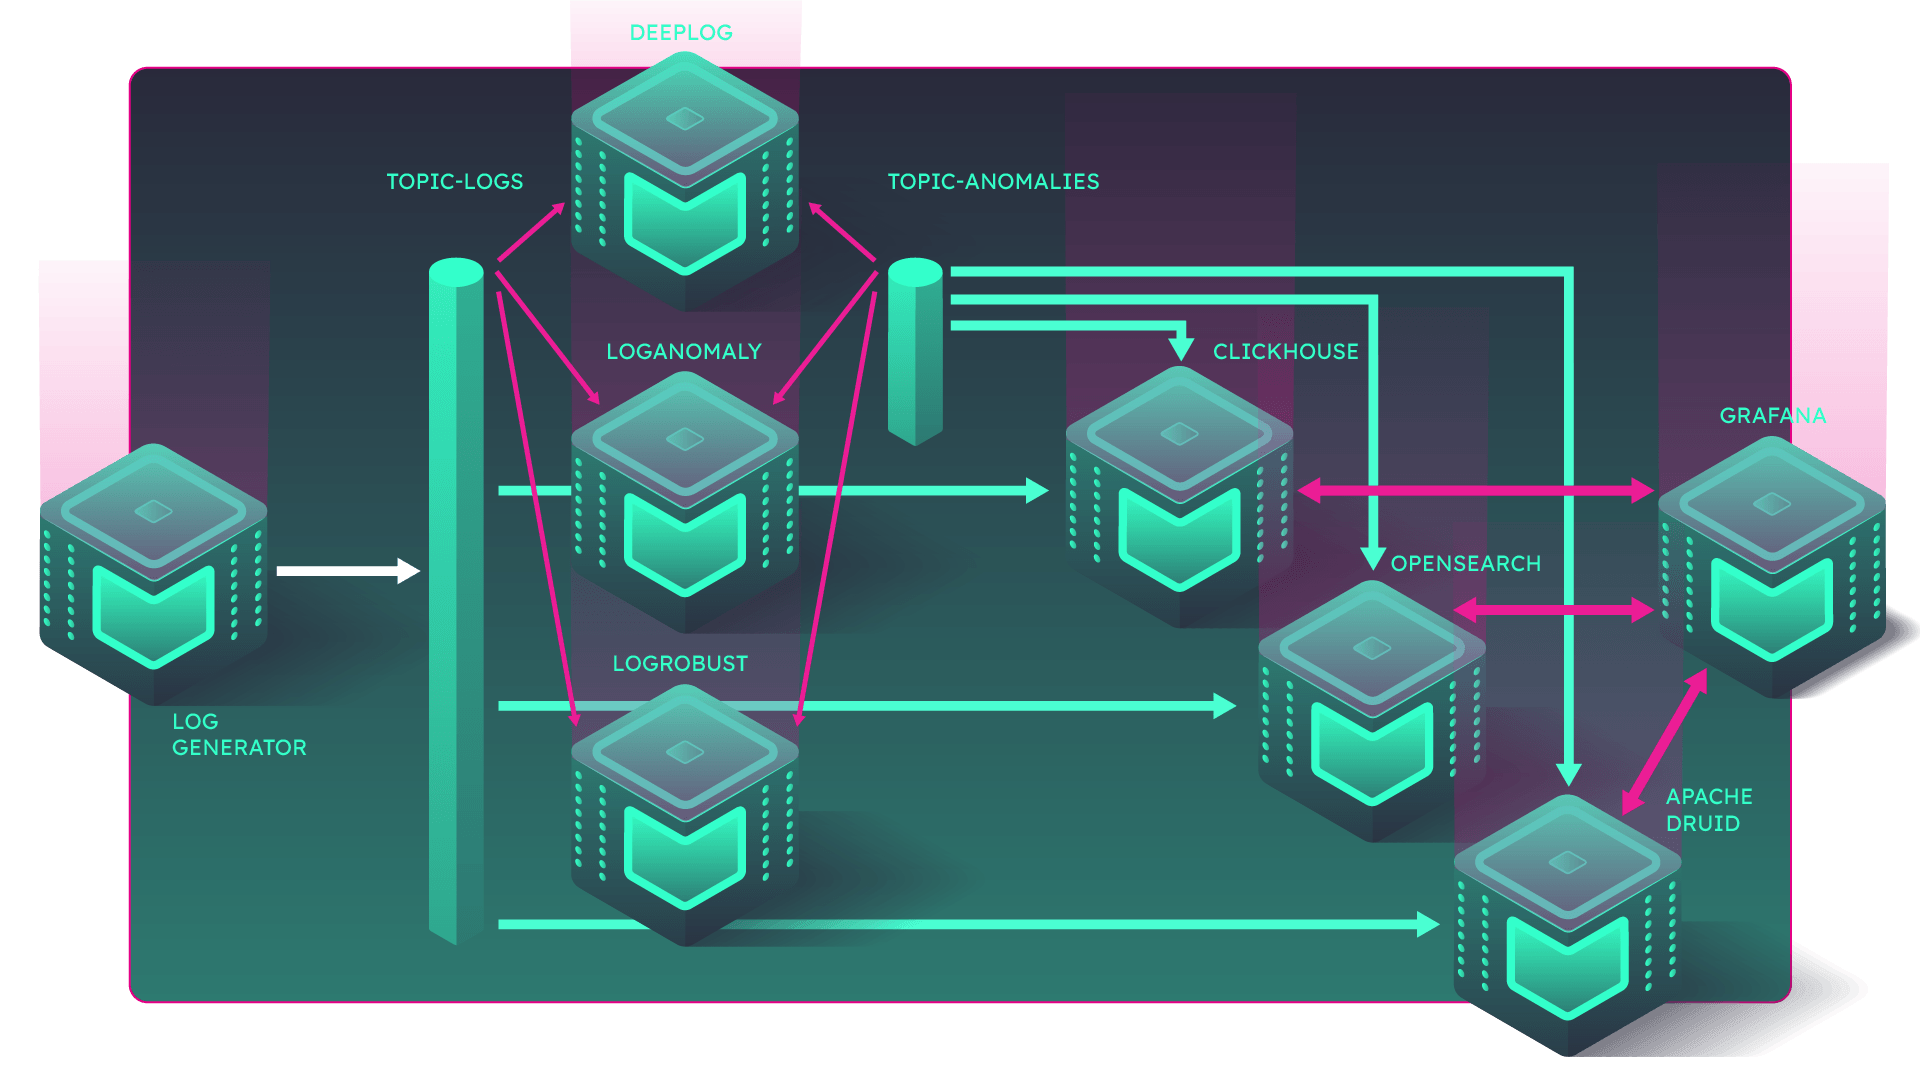
We have log-streaming solution, therefore we choose Apache Kafka as our first Qub. For data source, we will use Log Generator Qub. Then, we select Apache Druid Qub, ClickHouse Qub and OpenSearch Qub as our data store implementations. Select and drag log Anomaly Detection building blocks: DeepLog Qub, LogAnomaly Qub and LogRobust Qub. Drag Kafka topics for communication between components. Finally, drag Grafana Qub to use it as a visualization tools for anomaly recognition validation.

Select from the catalogue which data connectors to use; connect Log Generator to a Kafka topic, say topic-logs. From that topic ingest data into OpenSearch, ClickHouse, and Apache Druid by dragging arrows. Qubinets platform will do the rest. Don’t forget to consume data from topic-logs by all deep learning log anomaly detectors, and direct their output to another topic, say topic-anomalies. Connect Grafana to all three data storage engines.
Your model is ready to be verified and deployed to Kubernetes cluster of your selection. At the same time, Qubinets platform will make all setup for observability of your Qubs so that you can see amount of logs generated, various topic statistics (in, out, lag), ingestion mechanisms performance and most importantly your deep learning models performance.
Run the generator, freely change your log data production rates and other parameters. Check your anomalies via instantiated Grafana Qub. Use Qubinets Observability graphs for system performance measurements. Decide what seems to be the best for your needs. Easily remove unneeded components. Voila – your system is ready!
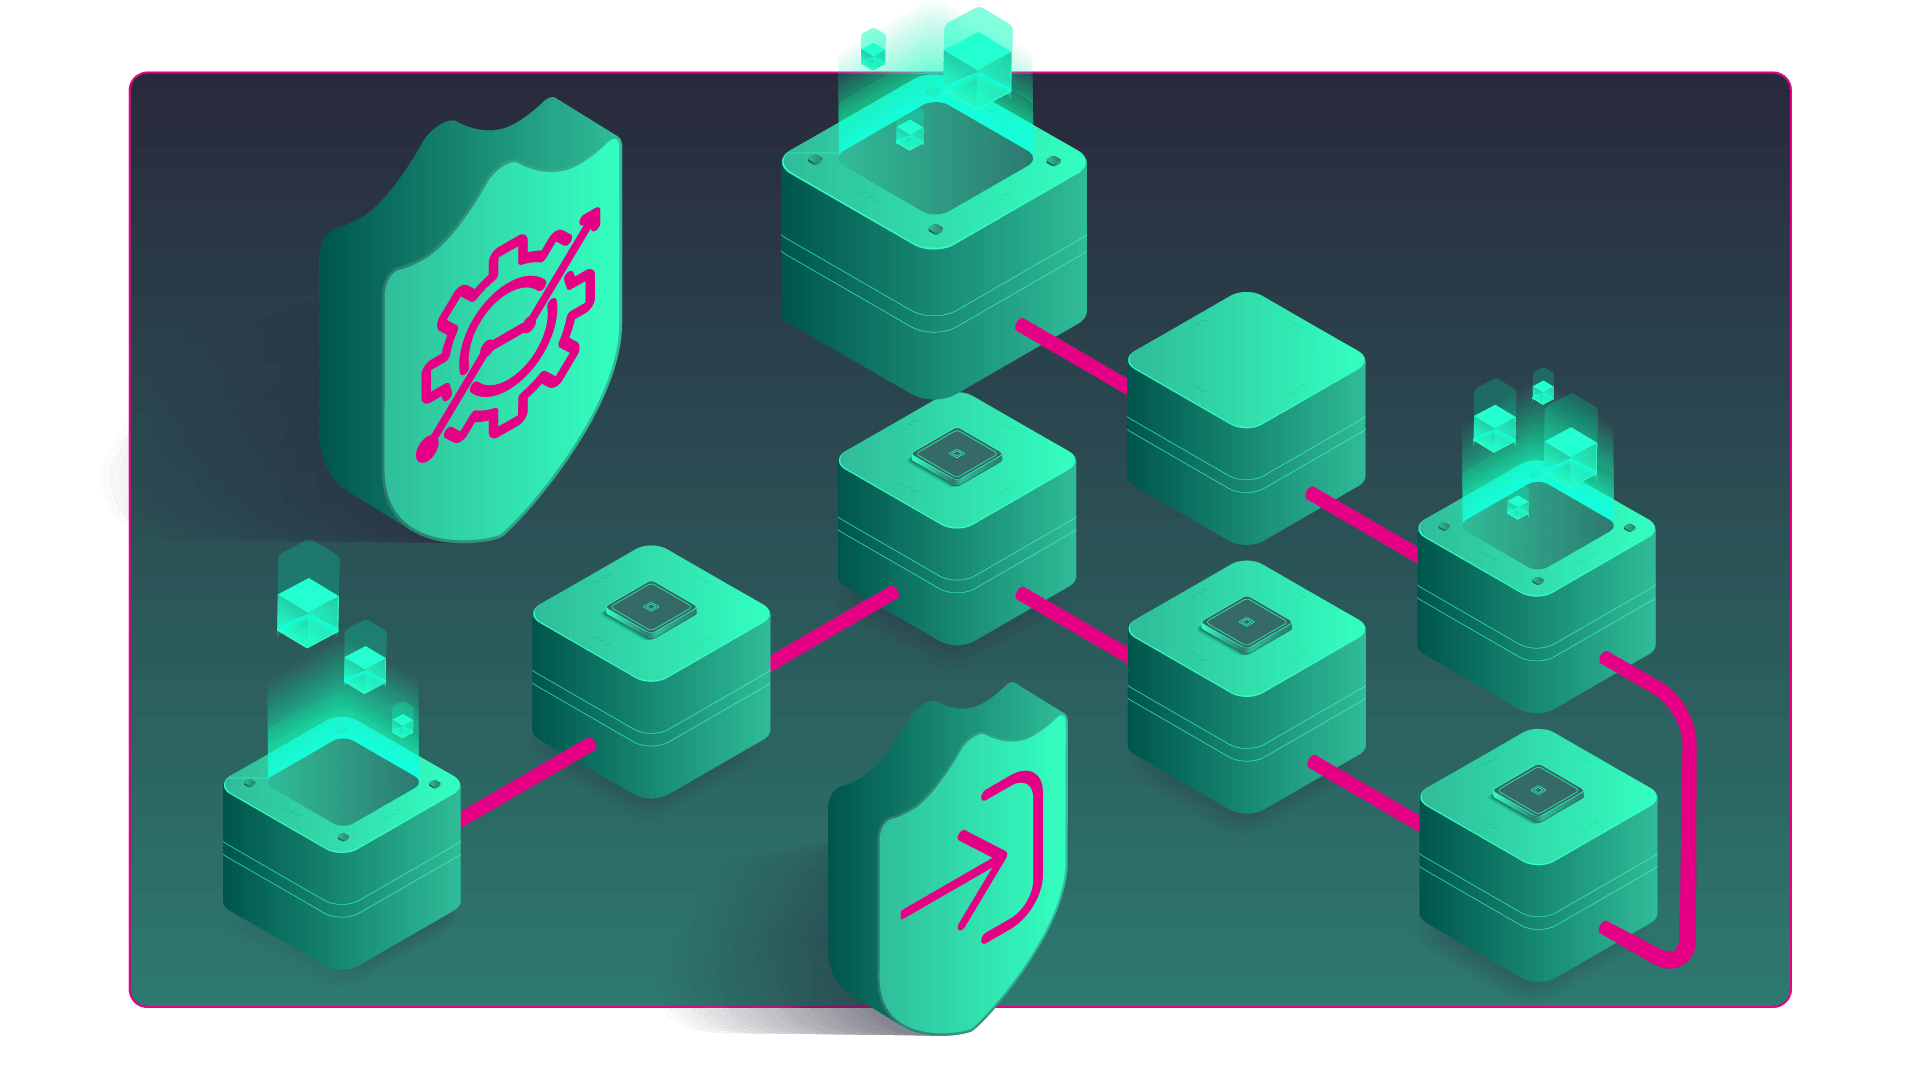
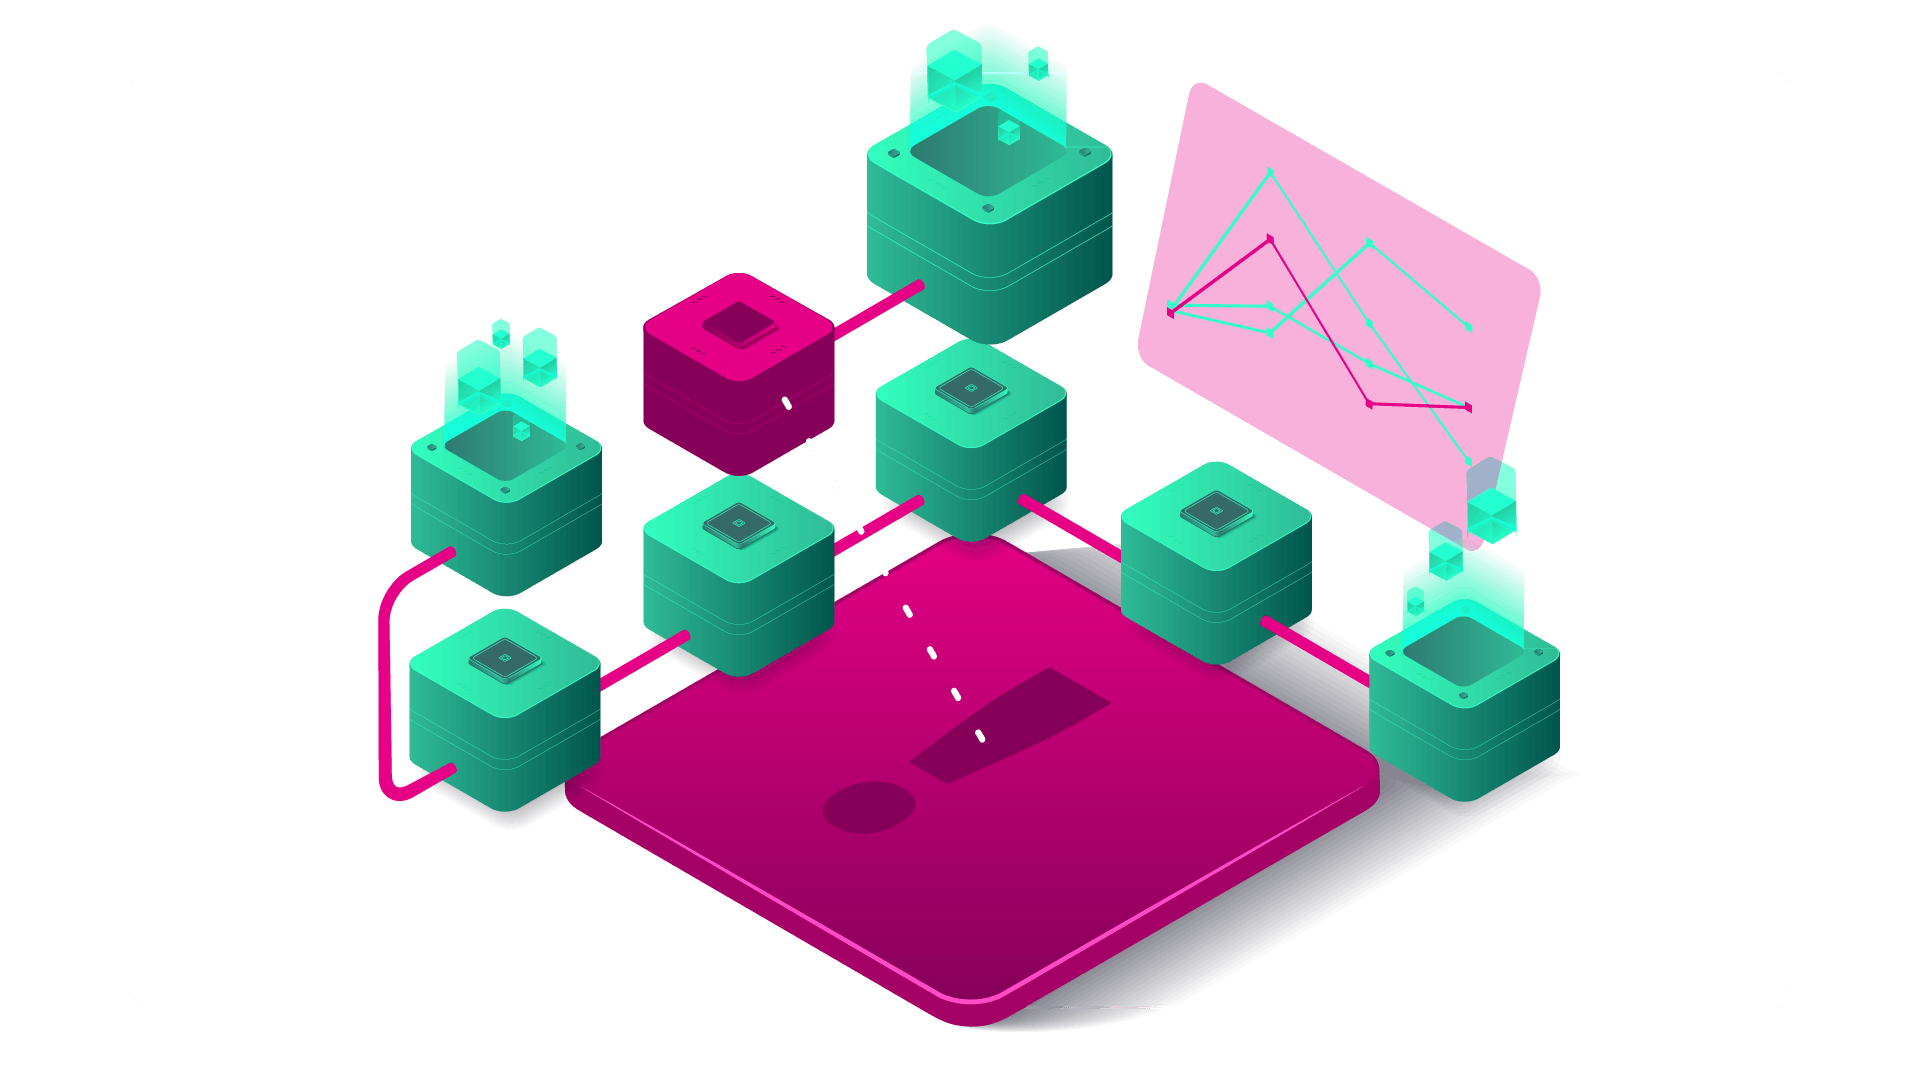
KAPPA ARCHITECTURE
Modular architecture with easy-to-try components
One of the valuable features of Qubinets platform is how easy it is to deploy tools, but also to setup data flows, and afterwards to observe the whole system. Here is an architecture of the hypotetic situation for selection of the most suitable log handling tools. Apache Druid, OpenSearch and ClickHouse for log storage. State-of-the-art anomaly detection implementations: DeepLog, LogAnomaly and LogRobust. Use Grafana for insight into results.