When it comes to setting up data visualization, there are a couple of ways to go about it. You can take the traditional, manual route—deploying each tool step by step—or you can opt for a more streamlined approach that cuts out the hassle. In this post, we’ll compare both methods: the usual hands-on setup and a simplified alternative using Qubinets. For consistency, we’ll be working with Digital Ocean as our cloud provider and using three powerful open-source tools: PostgreSQL, Grafana, and Airbyte
Setting up your own data visualization stack is often challenging, requiring not only significant time but also a good deal of technical expertise. But there’s an alternative that can make it much easier. Let’s dive in and see which approach might work best for you.
Traditional Data Visualization Setup: The Painful Reality
Let’s start by looking at the traditional approach of visualizing data, which involves manually installing and configuring each tool. This involves deploying Grafana, PostgreSQL, and Airbyte step by step, ensuring all the tools communicate effectively.
Step 1: Setting Up the Cloud Environment
First, you’ll need to create a droplet on Digital Ocean, which is basically a virtual server where all your tools will live. You’ll have to pick a suitable operating system, configure resources like CPU and memory, and handle SSH keys to securely access the droplet. This setup, although manageable, takes time and requires some basic knowledge of cloud infrastructure.
Once your droplet is up and running, it’s time to get into the nitty-gritty of setting up each service. Let’s dive into what that looks like.
Step 2: Installing PostgreSQL
Next, you’ll need to install PostgreSQL on your droplet. This involves SSH-ing into your droplet and running the appropriate commands to install the database server. After installation, you’ll also need to create a database and users to manage your data. Configuring user permissions is key—PostgreSQL has to be able to connect securely to other services like Airbyte and Grafana.
But it’s not just about installation. You’ll need to edit some configuration files to allow remote access, meaning other services (Grafana and Airbyte) can talk to PostgreSQL. Messing this up can lead to connection problems that are not always easy to fix.
Step 3: Setting Up Airbyte for Data Ingestion
Now that you’ve got your database ready, it’s time to bring in Airbyte. Airbyte helps you extract data from various sources and load it into PostgreSQL. To do this, you need to install Docker on your droplet, as Airbyte runs in Docker containers.
Once Docker is up, you download and start Airbyte. Then comes the configuration—you need to set up connectors that specify your data sources (like an API or a spreadsheet). You have to enter details like credentials API keys and ensure that the schema matches your PostgreSQL database structure. It’s a lot of work, and the smallest mismatch can cause headaches.
Step 4: Installing Grafana and Connecting Everything
Now comes the fun part: Grafana. You install Grafana, and like the previous steps, it requires a bunch of commands to get it running (e.g., `sudo apt-get install grafana`, `sudo systemctl start grafana-server`). After that, you need to connect Grafana to PostgreSQL, which means configuring a data source with all the necessary connection details—IP addresses, database name, user credentials, etc.
Even when everything is connected, there’s more to do. You need to build your dashboards by writing SQL queries to fetch the data you want, and then creating visualizations to make sense of it. This step takes some experience with SQL and a good understanding of what metrics you want to display.
Step 5: Managing Hosting and Maintenance
Finally, you need to keep the whole system running smoothly. This means managing server health, scaling as your data grows, and making sure everything is secure and backed up. If anything goes down, you’re on your own to troubleshoot the server, debug configurations, and keep things up to date. It’s not impossible, but it is quite a commitment.
The Qubinets Approach: Simplifying It All
Now, let’s look at the Qubinets approach—a simplified way to achieve the same setup. With Qubinets, you can set up the entire stack—Grafana, PostgreSQL, and Airbyte—in about 20 minutes. No need for SSH, complex installation commands, or hours spent tweaking configuration files. With Qubinets, everything is handled through a straightforward drag-and-drop interface, making the setup process much more intuitive.
Deploying the Cloud Environment
With Qubinets, you still use Digital Ocean (or any other cloud provider), but the platform takes care of provisioning the environment for you. You don’t need to manually select the operating system, configure network settings, or handle SSH keys. It’s all automated—you simply choose your cloud provider, and Qubinets gets to work setting up your infrastructure.
Connecting the Qubs
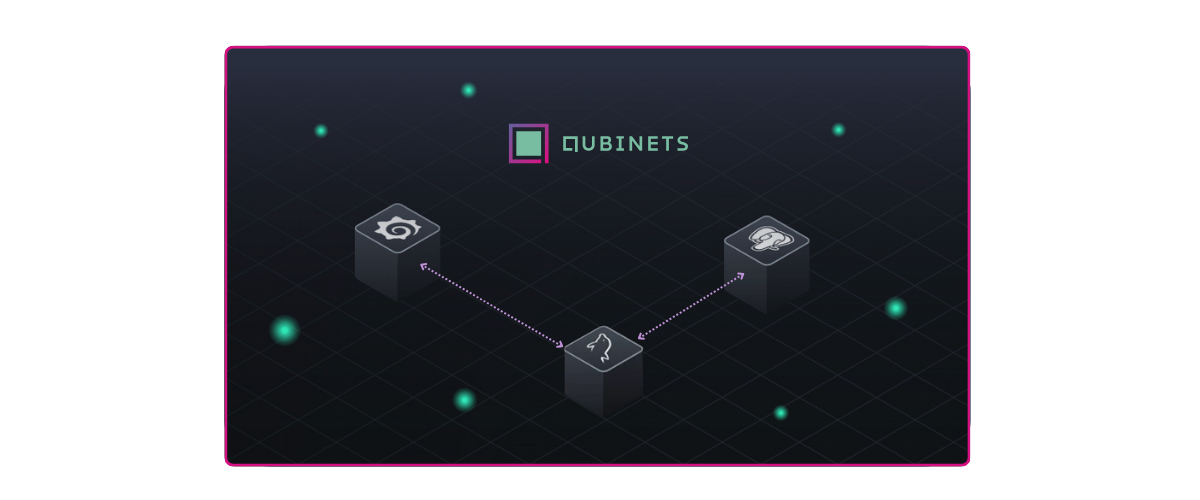
Qubinets offers a natural integration with open-source tools for data visualization like: PostgreSQL, Grafana, and Airbyte, allowing you to connect these tools directly through the Qubinets dashboard without the usual manual effort.
Here’s how the process works:
Step 1: Create Cloud Environment: From the Qubinets Dashboard, you choose Digital Ocean as your cloud provider. Qubinets takes care of provisioning everything, so there’s no need to manually configure operating systems or network settings.
Step 2: Connect Qubs: Qubinets integrates Grafana, PostgreSQL, and Airbyte seamlessly. From the Qubinets dashboard, you connect Grafana to PostgreSQL directly through a simple drag-and-drop process, ensuring that everything is configured exactly as required without any extra steps.
Step 3: Provision the Qubs: Once the tools are connected, you provision the chosen Qubs to the cloud. This provisioning typically takes around 10 minutes in Qubinets, with all components configured for optimal use.
This streamlined process eliminates the need for manual installation and configuration, saving you significant time and effort. By using Qubinets, you can focus on building data visualizations rather than troubleshooting setup issues.
Creating Data Visualizations
Once everything is in place, you can proceed to create your visualizations in Grafana. Since the tools are already linked up, you just start building. The Qubinets approach reduces setup time significantly, allowing you to focus on what really matters—understanding your data.
To see this entire process in action, check out our video below, which demonstrates how to visualize data with Qubinets step-by-step.
Key Differences: Traditional vs. Qubinets
Time Investment: Traditional setup can take hours or even days, depending on your experience level. With Qubinets, the entire process takes about 20 minutes.
Technical Expertise: The traditional approach requires you to know how to install software, configure networking, and work with cloud infrastructure. Qubinets abstracts all of this, making it accessible even if you’re not a DevOps expert.
Error-Prone vs. Error-Free: The manual setup is inherently prone to errors—a missed configuration can break connections. With Qubinets, everything is pre-configured to work seamlessly, drastically reducing the chance of errors.
Maintenance: In the traditional approach, you are responsible for monitoring, updating, and scaling your setup. Qubinets automates these processes, meaning you spend less time on maintenance and more time visualizing data.
Conclusion
Both approaches—traditional and Qubinets—get you to the same end goal: a data visualization stack using Grafana, PostgreSQL, and Airbyte. But how you get there makes all the difference. The traditional method demands time, effort, and technical knowledge. In contrast, Qubinets simplifies the entire process, reducing it to a few clicks and letting you get started in minutes rather than days.
If you’re looking to avoid manual installations and configurations, and want a straightforward way to set up data visualization, give Qubinets a try.
Simplify your workflow. Start with Qubinets today.


